
This article outlines the Best Free On-Chain Indicators used to analyze blockchain data to help traders and investors identify trends in the crypto market.
Indicators like Exchange Inflows and MVRV, along with SOPR and HODL Waves, offer peerless, up-to-the-minute assessments of market sentiment, network dynamics, and investor trends, rendering informed decision-making feasible without expensive tools or guesswork.
What are Free On-chain Indicators?
Free on-chain indicators are analytic tools that give users insights into blockchain data concerning network activity, user behavior, and market trends at no cost within the cryptocurrency and blockchain ecosystem.
On-chain metrics are key to understanding transaction volumes, the activity of wallets, mining, the distribution of token supply, network health, and the criteria used by analysts, investors, and traders to make decisions.
Using on-chain data, users can understand market sentiment, fundamental components of a blockchain ecosystem, prospective investments, and other valuable insights without a third-party price prediction service, paid service, or subscription.
Why Use Free On-chain Indicators
Cost-effective Analysis: These indicators offer insights into the blockchain without having to pay for a subscription.
Transparency: Data originates from the blockchain, which means less reliance on intermediates, and trust issues are minimized.
Market Sentiment Insights: Analyzes the behavior of investors, transactions, and activities within the network.
Early Trend Detection: Recognizes bullish and bearish indications beforehand, which helps in estimating changes in the price of the market.
Portfolio Management: Supports the decision to buy, sell, or hold a particular cryptocurrency.
Long-term Fundamental Analysis: Provides insights on token dispersal, network growth, and other adoption metrics.
Enhanced Trading Strategies: Real-time blockchain information on metrics of volume, transactions, and addresses can be a value add to technical analytics.
Key Point & Best Free On-chain Indicators List
| Indicator | Description |
|---|---|
| Exchange Inflows | Tracks the amount of cryptocurrency moving into exchanges, indicating potential selling pressure. |
| Market Value to Realized Value (MVRV) | Compares market capitalization to realized capitalization to identify overvalued or undervalued conditions. |
| Exchange Outflows | Measures cryptocurrency leaving exchanges, often signaling long-term holding or reduced selling pressure. |
| Spent Output Profit Ratio (SOPR) | Shows whether coins moved on-chain are being sold at a profit or loss. |
| Realized Cap | Calculates the value of all coins at the price they last moved, reflecting the network’s true market value. |
| Active Addresses | Counts unique addresses transacting, indicating user activity and network engagement. |
| HODL Waves | Visualizes the age distribution of held coins, showing long-term versus short-term holding trends. |
| Whale Transaction Count | Tracks large transactions by whales, revealing potential market-moving activity. |
| Miner Outflows | Measures coins leaving miners’ wallets, which can indicate selling pressure from mining operations. |
| Trade Intensity Metric | Quantifies transaction activity relative to network supply, reflecting trading momentum. |
1. Exchange Inflows
One of the most effective free indicators we have on-chain is exchange inflows, precisely because of the nature of cryptocurrency flowing in to exchanges. It also captures raw and real market activity. This metric specifically indicates potential outflows.

This is due to higher exchange inflow rates being indicative of potential sellers, while lower rates suggest retention, on the other hand, coins are moved to cold storage.
Compared to other indicators like price or speculative data, exchange inflows indicators are more reliable because they come directly from the blockchain and reflect real market sentiments. This allows traders and analysts to anticipate and determine their position in the market without the use of paid tools.
Exchange Inflows Features
- Measure of Sell Pressure: Measures the volume of digital currency moving to exchanges, suggesting possible selling activity.
- Liquidity Insights: Increased inflows suggest increased liquidity for trading.
- Market Sentiment Indicator: Sudden increases may suggest holders are selling at a loss, and may indicate panic selling.
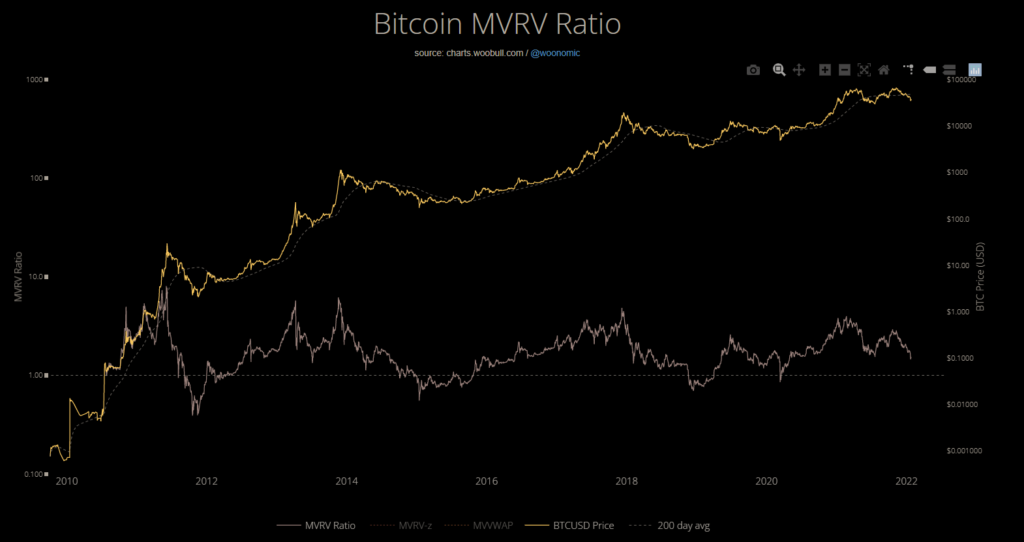
2. Market Value to Realized Value
The Market Value to Realized Value (MVRV) ratio is a fantastic complementary free on-chain metric as it reveals if a crypto asset is over- or underpriced in relation to its on-chain activity.
The MVRV goes beyond simply looking at price charts by comparing current market cap with realized cap, revealing market pressures and behavior. This feature makes it an indispensable resource in estimating market tops and bottoms.
As it is derived from blockchain technology, it is self-evident and provides instantaneous information to traders and investors to formulate their own analytics as opposed to purchased analytics.
As Realized Value is derived from on-chain activity, it is possible to rapidly estimate the Realized Value of a cryptocurrency.
Market Value to Realized Value (MVRV) Features
- Profitability Assessment: Estimates over or under valuation of an asset by looking at market prices relative to the most recent moving average at which coins were transferred.
- Identifies Market Tops/Bottoms: Very high MVRV may indicate the market is overbought while a low MVRV may suggest accumulation.
- Investor Behavior Insight: Overall market HODL sentiment is gauged, whether holders are in a profit or in a loss.
3. Exchange Outflows
Exchange outflows provide very useful free on-chain indicators since they provide information on how much cryptocurrency is leaving the exchanges which indicates how much the market is sentiment and how much coins are being held for very long periods of time.
Coins leaving the exchanges usually indicates that the investors are taking coins and putting them in private wallets for long term storage or they are long term holders which makes coins less available for immediate selling.
This gives the traders a good opportunity that they will be able to predict how available coins will be sold at exchanges and predict bullish trends. Unlike indicators, price outflows are based on exchange activity that is not speculative.
While investors are able to get real-time information on prices, there is a whole set of speculative metrics that price investors are able to get and real-time information on the exchanges.
Exchange Outflows Features
- Measure of Accumulation: Coins leaving exchanges are a sign of long-term accumulation and HODLing as coins are transferred to cold storage.
- Reduced Sell Pressure: Potential sell-offs are supported by reduced on-exchange supply.
- Market Confidence Signal: Large outflows suggest long-term confidence in the asset.
4. Spent Output Profit Ratio (SOPR)
The Spent Output Profit Ratio (SOPR) is a great free on-chain metric and potentially the most valuable one. SOPR shows how profitably coins that have been moved and sold on-chain.
This creates a sense of market sentiment and how market movers and sellers feel about current on-chain liquidity and coins. Even more interesting is how SOPR shows a behavior pattern of on-chain investors—whether they take profit, are willing to lose, or if they hold on to their coins.

This reliability and behavior theory allows to detect of short-term shifting market sentiment and the probability of market reversal. SOPR is calculated and derived from on the chain transaction data and is as free as on-chain data and sources are.
Thus, traders and analysts can make informed decisions that are potentially speculative and strategic in nature, all in real time and cost-free.
Spent Output Profit Ratio (SOPR) Features
- Profitability Tracker: Assesses whether sold coins are at a profit or loss by analyzing spent outputs.
- Market Cycle Insight: Identifying market tops when the SOPR is high and bottoms when the SOPR is below 1.
- Trend Confirmation: Confirms a bullish or bearish trend by checking if the majority of coins are profitably sold.
5. Realized Cap
Realized Cap is one of the best free on-chain metrics available because it computes the total value of all coins in circulation based on the price at which they last changed hands, instead of the market price, which helps to more accurately assess the true economic worth of the network as a whole.

This helps separate real growth in the market from growth based on mere speculation, which helps in the assessment of network health, as well as the behavior of long-term investors.
Because it uses actual trading data, Realized Cap accurately reflects the value that traders and analysts can’t manipulate. This provides a basis for identifying market imbalances and forming strategic positions based on well-grounded analysis instead of paid analytic services.
Realized Cap Features
- True Market Valuation: Computes the value of coins with the most recent prices at which they moved instead of the current market price.
- Long-term Trend Indicator: Focuses on the trends that show the most long-term growth or decline and show a clearer picture of investor commitment.
- Market Strength Analysis: Increasing realized market cap indicates stronger market adoption and accumulation.
6. Active Addresses
Active addresses represent one of the finest free on-chain indicators as they capture unique addresses involved in transactions thus showing the actual participation level of the network and the engagement of the users.

Price charts solely show the sentiment of the market, but active addresses show the actual activity and level of adoption in a cryptocurrency. Increasing active addresses suggest demand and network activity.
Decreasing active addresses suggest lower interest. The value of active addresses as an indicator lies in their transparency and real-time data, allowing users to assess the strength of a network and suggest the changing value of the indicator on their investments or trades.
Active Addresses Features
- User Activity Measure: Counts the unique addresses that take part in transactions and show a sign of network usage.
- Demand Indicator: High network activity can signal an increase in the demand and adoption of the cryptocurrency.
- Bullish/Bearish Signals: Declining active addresses may point to a lack of network engagement and potential market weakness.
7. HODL Waves
HODL Waves is an excellent free on-chain indicator because it displays how long each coin-issuer has held each coin in the blockchain. This uncommon viewpoint records if an investor is a long-term holder or a short-term trader.
This determines the trends in the sentiment of the market and the estimated stability of the market in a given time. HODL Waves monitors dormant and actively moving coins in the blockchain to detect trends in long-term holders and short-term traders.
HODL Moves is unique because its inputs are always transparent, costing no restrictions in time, and using genuine blockchain data to make real-time market assessments. Then they capitalize on true investor behavior compared to cost-free priced market behavior.
HODL Waves Features
- Investor Holding Patterns: Distributes coins based on the length of time they are held, and reveals long-term holders and short-term holders.
- Market Sentiment Analysis: Strong conviction in market holders is shown by HODL periods that last longer in time.
- Price Stability Potential: Performing heavy long-term holding will likely reduce volatility of the holding in the market.
8. Whale Transaction Count
Whale Transaction Count ranks among the best free on-chain metrics because it records the large cryptocurrency transfers made by holders with significant balances, or ‘whales.’
This unusual metric captures valuable market moving activity because large transfers made by whales are often precursors to major price changes or indicate the accumulation and distribution phases on either side of the market.

The ability to measure the value and direction of these transfers provides traders and analysts with more precise tools for trend anticipation and sentiment analysis.
Unlike price charts, which are highly manipulated, Whale Transaction Count relies on the blockchain and provides real-time information. Given the powerful behavior it captures, Whale Transaction Count offers strategic value for traders and investors for no cost at all.
Whale Transaction Count Features
- Large Holder Activity: It Tracks the transactions of addresses holding considerable quantities, providing details of big player movements.
- Market Impact Predictor: Heightened whale activity tends to precede significant market price fluctuations.
- Liquidity Balance: Whales dispatching their coins alters the equilibrium of the market’s short-term supply and demand.
9. Miner Outflows
Miner Outflows serve as great free indicators on the chain since they analyze new coins as they flow from the wallets of miners to exchanges or other addresses, giving indications to possible selling pressure.
Unlike other metrics, this one gives insights into the miners, who can have a critical impact on supply and, therefore, short-term price fluctuations.

When the outflows are high, it is possible that the miners are liquidating their coins, therefore, outflows of this nature are possibly indicative of a bearish price cycle.
In contrast, lack of outflows implies accumulation or long-term holding. Because miner outflows are not based on prices, they provide a great cost-free way of estimating conjectural prices and making smart trading choices.
Miner Outflows Features
- Supply Pressure: Measures coins leaving the miners’ wallets and thus increases the sell pressure in the market.
- Revenue Insight: Miners’ selling decision helps to determine their confidence in the market and their willingness to in coins.
- Market Sentiment: High miner outflows could represent their wish to profit or cover running costs which leads the sentiment down.
10. Trade Intensity Metric
The Trade Intensity Metric is a powerful free on-chain indicator because of its capability of measuring transactional activity concerning a cryptocurrency’s total supply. It filters market engagement and transactional momentum.
Unlike other pricing charts which display appreciation and depreciation, this indicator shows when coins are actively traded on the blockchain and when investors are closed or inactive.
This is constructive in identifying potential market trends, accumulation patterns, or periods of impending volatility. The Trade Intensity Metric is designed from the ground up on open blockchain resources and offers real-time data. This makes it an invaluable, cost-free resource for traders and investors.
Trade Intensity Metric Features
- Activity Measure: It covers the total transactions completed and their values in a defined time span.
- Volatility Measure: The market is likely to experience high value fluctuations if the trade volume is heavy.
- Market Momentum: It illustrates the prevailing momentum in the market, whether it is increasing or declining.
Pros & Cons
| Pros | Cons |
|---|---|
| Cost-effective: Completely free, allowing anyone to access valuable blockchain insights without subscription fees. | Limited Features: Free tools may not provide advanced analytics or detailed visualizations compared to paid platforms. |
| Transparency: Derived directly from blockchain data, ensuring authenticity and reducing reliance on third-party sources. | Data Overload: Beginners may find the sheer volume of metrics confusing without proper understanding. |
| Real-time Insights: Provides up-to-date information on network activity, transactions, and investor behavior. | Requires Interpretation: Raw data often needs analysis and experience to make actionable decisions. |
| Market Behavior Tracking: Helps identify trends, investor sentiment, and potential price movements. | No Financial Advice: Indicators show data trends but cannot predict exact market outcomes. |
| Supports Strategic Decisions: Useful for trading, investing, and long-term portfolio planning. | Limited Support: Free platforms may not offer customer support or tutorials for advanced users. |
| Independent Analysis: Allows investors to rely on actual blockchain activity rather than speculative metrics. | Possible Lag in Some Metrics: Certain indicators may update slower than paid tools or exchanges. |
Conclusion
In summary, top free on-chain indicators deliver valuable analyses of cryptomarkets using open, instantaneous blockchain data.
Tools such as Exchange Inflows, MVRV, SOPR, HODL Waves, and Whale Transaction Counts help participants gauge sentiment, diagnose market activity, and comprehend network behavior without expensive tools and predictive guessing, even though free tools can lack some features and costly predictive.
Even though free tools can lack some features, advanced analytics, and predictive guessing functionality, accessibility, situation awareness, and a lack of costly predictive guessing functionality make free on-chain indicators a key resource for assisting rational choice.
Retention analysis capabilities and the situation awareness help them predict, control, and balance their on-chain activity toward positive and productive strategic rational analysis and plan definition and adherence.
FAQ
Yes, but beginners may need to spend time understanding how each metric works and how to interpret the data, as raw blockchain metrics can be complex.
They can be accessed on blockchain explorers, analytics platforms like Glassnode, CryptoQuant, and directly from some exchange dashboards that provide on-chain data.
Some widely used free on-chain indicators include Exchange Inflows, Exchange Outflows, MVRV, SOPR, Realized Cap, Active Addresses, HODL Waves, Whale Transaction Count, Miner Outflows, and Trade Intensity Metric.
They offer transparent, real-time insights into market sentiment and network health, helping traders and investors make informed decisions based on actual blockchain activity rather than speculative price charts.
Free on-chain indicators are metrics derived directly from blockchain data that provide insights into network activity, investor behavior, and market trends without any cost. They track transactions, wallet activity, coin age, miner movements, and other on-chain factors.